Climate and Weather Charts
Melbourne Airport (MEL)
(Melbourne, Victoria - VIC, Australia)

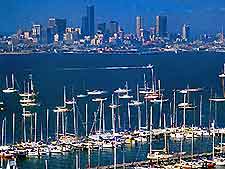
Melbourne lies on the southeastern coast of Australia and features a subtropical climate and an enviable coastal setting. Located in the southern hemisphere, the summer season in Melbourne, from December to February, has much to offer, with plenty of hot sunny weather and a fairly low rainfall, compared to other prominent Australian cities. Summer temperatures can be hot, although the cooling breezes from nearby Port Phillip Bay are always welcomed.
The city of Melbourne is known for its changeable weather and climate, particularly during the winter months of June, July and August, when sunny weather can often experience unexpected showers. The average annual daytime temperatures in Melbourne are around 20°C / 68°F.
Climate Description: Subtropical climate
Melbourne Airport (MEL) Location: Southern Hemisphere, Australia, Victoria
Annual High / Low Daytime Temperatures at Melbourne: 26°C / 13°C (79°F / 55°F)
Average Daily January Temperature: 26°C / 79°F
Average Daily June Temperature: 14°C / 57°F
Annual Rainfall / Precipication Melbourne at Airport (MEL): 568 mm / 22 inches
Melbourne Airport (MEL):
Climate and Weather Charts
Temperature Chart |
| Temperatures |
Jan |
Feb |
Mar |
Apr |
May |
Jun |
Jul |
Aug |
Sep |
Oct |
Nov |
Dec |
Average |
Maximum
Celcius (°C) |
26 |
26 |
24 |
20 |
17 |
14 |
13 |
15 |
17 |
20 |
22 |
24 |
20 |
Minimum
Celcius (°C) |
14 |
14 |
13 |
11 |
8 |
7 |
6 |
7 |
8 |
9 |
11 |
13 |
10 |
Maximum
Fahrenheit (°F) |
79 |
79 |
75 |
68 |
63 |
57 |
55 |
59 |
63 |
68 |
72 |
75 |
68 |
Minimum
Fahrenheit (°F) |
57 |
57 |
55 |
52 |
46 |
45 |
43 |
45 |
46 |
48 |
52 |
55 |
50 |
Rainfall / Precipitation Chart |
| Rainfall |
Jan |
Feb |
Mar |
Apr |
May |
Jun |
Jul |
Aug |
Sep |
Oct |
Nov |
Dec |
Total |
| Rainfall (mm) |
46 |
51 |
33 |
53 |
53 |
36 |
28 |
56 |
46 |
61 |
64 |
41 |
568 |
| Rainfall (inches) |
1.8 |
2.0 |
1.3 |
2.1 |
2.1 |
1.4 |
1.1 |
2.2 |
1.8 |
2.4 |
2.5 |
1.6 |
22 |
Seasonal Chart |
| Seasons |
Average
Temp
(Max °C) |
Average
Temp
(Min °C) |
Average
Temp
(Max °F) |
Average
Temp
(Min °F) |
Total
Rainfall
(mm) |
Total
Rainfall
(inches) |
| Mar to May (Autumn / Fall) |
20 |
11 |
69 |
51 |
139 |
6 |
| Jun to Aug (Winter) |
14 |
7 |
57 |
44 |
120 |
5 |
| Sept to Nov (Spring) |
20 |
9 |
68 |
49 |
171 |
7 |
| Dec to Feb (Summer) |
25 |
14 |
78 |
56 |
138 |
5 |
 Melbourne lies on the southeastern coast of Australia and features a subtropical climate and an enviable coastal setting. Located in the southern hemisphere, the summer season in Melbourne, from December to February, has much to offer, with plenty of hot sunny weather and a fairly low rainfall, compared to other prominent Australian cities. Summer temperatures can be hot, although the cooling breezes from nearby Port Phillip Bay are always welcomed.